


Provide Azure Redesign
***Second Phase Now Released***
The Provide portal's Azure module has undergone an extensive revamp, giving you faster access to timelier and more accurate spend data. These updates include:
- Significant performance improvements, including more up-to-date spend data
- Enhanced charting capabilities to analyse spend and forecasts
- Improved budgeting tool
- More in-depth analysis of Recurring Spend
- Resource Explorer to drill-down into spend
- Trends and Insights generator
- Dedicated export tool, including scheduled exports
This article aims to give you a more detailed insight into the changes that have been released. It also includes a 'Where do I find…' section if you are looking for something that was in the previous version of the module. If you have any feedback on the new look Azure module, please use the 'Send Feedback' function found above your username in the sidebar.
Phase 2 Release Notes
The second phase of the Provide portal's Azure module includes:
- Resource Explorer to drill-down into detailed spend data
- Insight generator to give quick oversight of important changes in spend data
- Trend analysis showing how Subscription spend is changing
- Addition of scheduled exports to the dedicated export tool
- Save personalised views of key data
Key Features
Resource Explorer
The Resource Explorer is a decomposition graph-style tool allowing you to drill-down into your spend data to a Resource level.
The explorer can be filtered by date using the period filter, meaning current and previous spend can be analysed.
The explorer's navigation facilitates travel from the top of the tree (Subscription), through a configurable pathway down to the bottom (Resource). Use the drop-down column headers to adjust the middle portion of the route - options include Category, Resource Group, Location and Tag. If the Tag option is selected, a Tag prefix from your spend data can be selected (EG. Environment), allowing you to explore tagged spend (EG. Non-Production).
Trends & Insights
Trends & Insights is a tool to use alongside the information provided by the Overview page, highlighting additional useful data points to assist you in managing your Azure spend.
Insights
Insights are generated using the following types: New Spend, Removed Spend, Increased Spend, Decreased Spend, and Unusual Spend. They are calculated against data from Tenant down to Resource Group level and cover a time period of up to one year depending on the type of insight. To ensure the insights remain helpful, algorithms are used to ensure only the most relevant data points are flagged.
Newly generated insights are highlighted at the top of the page so that you don't miss anything - these can be dismissed on a per-user basis once they have been reviewed.
All insights are displayed in the Insights table, which can be filtered by Period, Level, Type and Subscription. The table also allows the opening of an individual insight record to discover more detailed information about the flagged data point.
Trends
The Trends section compares rolling monthly spend to the average spend over the last year, flagging where the spend appears to be trending significantly up or down from the average. This trend analysis can be viewed at a Tenant or Subscription level.
Data Export
Please note that the Data export function has been updated between Phase 1 and Phase 2 to allow for faster exports and export scheduling. As part of these updates, export files will now be in a zipped file when downloaded.
Exports
Data exports are now more customisable than ever, all of which can be selected through the Export drawer.
To export data immediately (as in previous versions), open the Export drawer and simply select which Tenants/Subscriptions and which months are to be included before clicking the Export button. The requested export will be added to the Exports table with a state of PENDING, which will quickly change to COMPLETED. Once complete, click on the export record and click on Download to retrieve the export file.
For scheduled and recurring exports, the same process is followed, except that additional parameters are used to set up a future data export. Selecting a Start Date will set the scheduled export date, or for recurring schedules will determine when the first recurrence will take place. Recurring exports can be further customised to run on a monthly (including a 'last day of the month' option), weekly or daily schedule. Each recurrence of the data export will add a new file to download to the export record. Existing scheduled and recurring exports can be cancelled when no longer required.
By default, all data exports are stored ready for download by Cloud Direct. However, they can also be sent directly to a customer's own Azure Storage container via a Shared Access Signature (SAS token) URL. The SAS token URL should be provided in the Export Destination field, allowing some validation checks to be completed before it is used.
Exports can be given both a name and description, which can be helpful to identify exports when retrieving previously scheduled exports.
For any export the selected Subscriptions can be merged into a single file per month (default), or they can be placed into a folder containing one file per subscription, per month by deselecting Merge into One File.
Data Export Example/Column Descriptions
The rest of the Data Export page gives you an insight into the data you will be downloading. The Data Export Example shows you the formats to expect for each column, and the Column Descriptions explain what each part of the data represents.
Overview - View Presets
One of the benefits of the Overview section is being able to build a custom graph using the multitude of options and filters. Now there is the ability to create and save multiple custom graphs using the View Presets function.
Get the graph looking exactly as required and then click View Presets and the '+' symbol. Give the view a name and click the pin icon to save the view. To load the view in the future, simply click View Presets and select your newly created view from the list.
Phase 1 Release Notes
The first phase of the Provide portal's Azure module includes:
- Significant performance improvements, including more up-to-date spend data
- A complete redesign of the UI
- Introduction of new headline figures and associated insights
- Enhanced charting capabilities to analyse spend and forecasts
- Improved budgeting tool
- More in-depth analysis of Recurring Spend
- Dedicated export tool
Key Features
Overview
Azure Spend Summary
A quick view of your total year-to-date spend (including recurring spend), as well as your total projected spend for the year.
Consumption Summary
Key data highlights to show your current spend. Also includes comparisons to your budget or previous period's spending.
These tiles can be filtered by Tenant/Subscription using the Subscription picker.
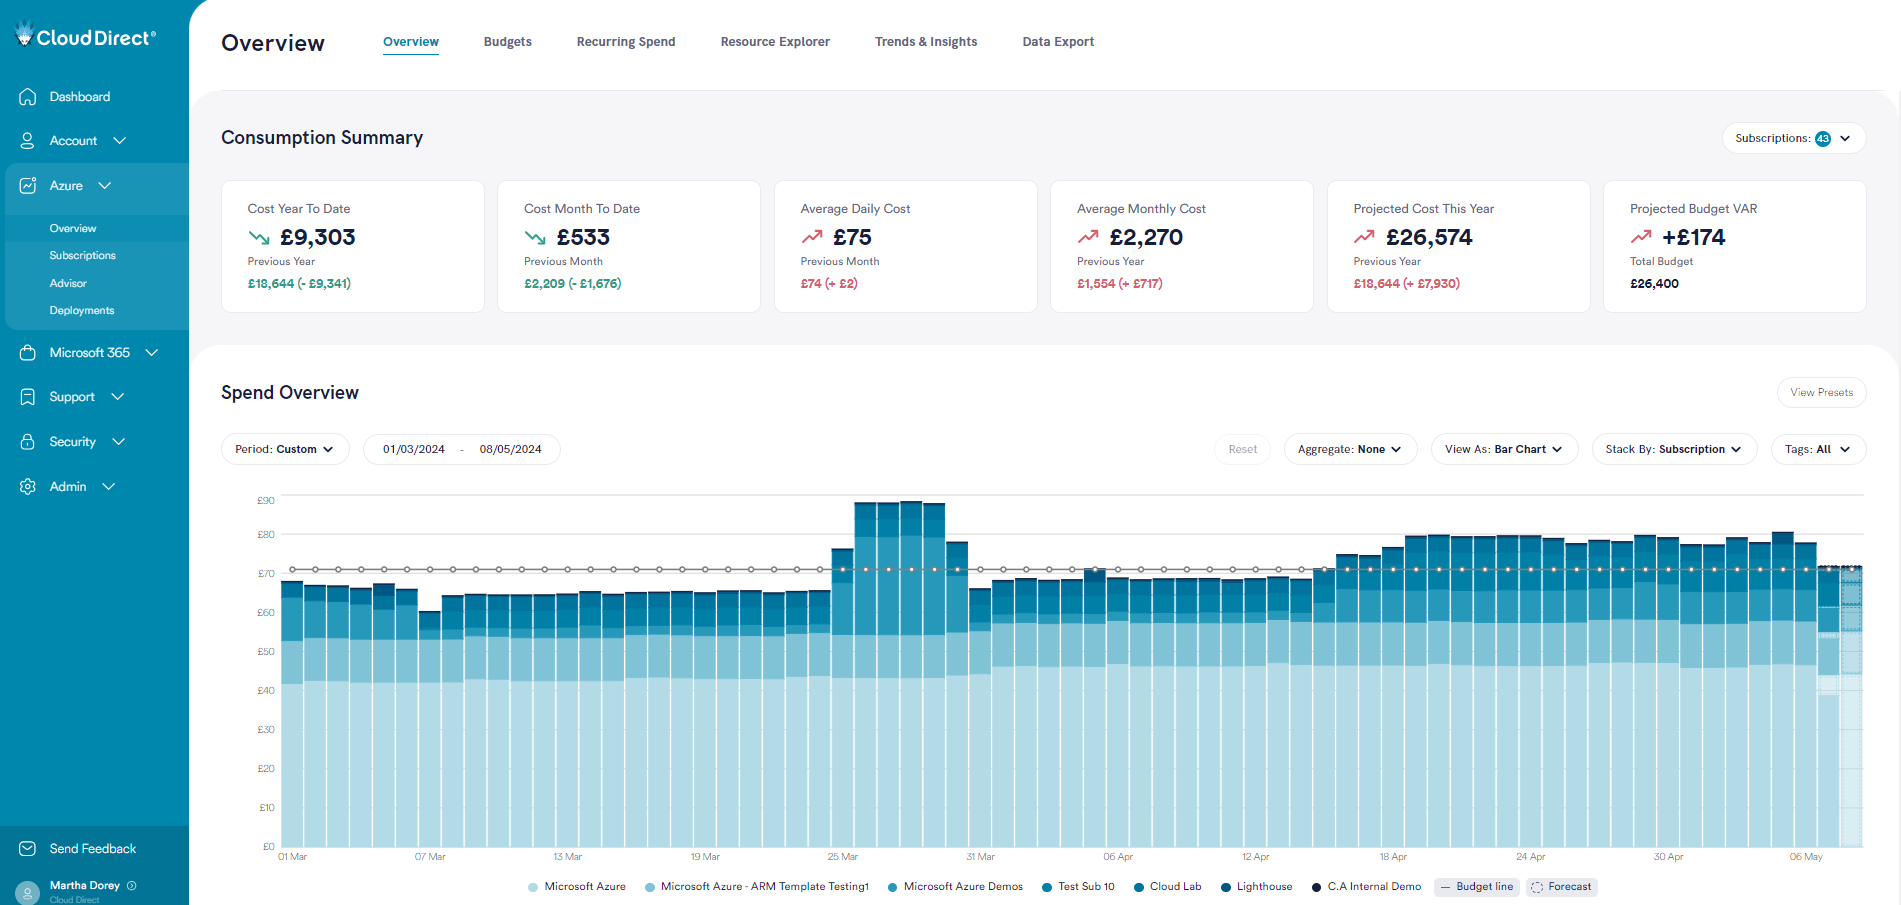
Spend Overview
The main graph gives you multiple options to analyse your spend data, meaning you can customise the view to suit your requirements. The graph will also include forecasting data and a representation of any budgets you have set.
The graph options available are:
- Period:
- Year to Date – All spend so far this year
- Current Year – All spend so far this year, plus a forecast for the remainder of the year
- Previous Year – All spend for the previous year
- Month to Date - All spend so far this month
- Current Month - All spend so far this month, plus a forecast for the remainder of the month
- Previous Month – All spend for the previous month
- Custom – Ability to view up to 18 months of historical spend
- Aggregate:
- None – Spend and forecast will be shown per day/month depending on the selected period
- Cumulative – Spend and forecast will be shown as a running total
- View As:
- Bar Chart – Spend and forecast are shown in a bar chart, with multiple Stack By options.
- Area Chart – Spend and forecast are shown in an area chart, with multiple Stack By options.
- Table – Exact spend figures are shown in tabular format (no forecast is available)
- Line – Spend and forecast are shown as a single line (no Stack By is available)
- Stack By groups spend and forecast in the graph by Tenant, Subscription, Service, Region or Resource Group.
- The Tags filter allows the filtering of spend in the graph by up to 10 tags at a time. This filter is searchable – begin typing to start a search.
- Ledger selections allow you to switch off elements of the graph such as forecasting or budgets. They also allow you to drill down further into the data by selecting a subset of the displayed items EG. Tenants.
This section also includes Pie and Bar charts showing a breakdown by Tenant/Subscription/Service/Region/Resource Group for the selected period and tags. These do not include any forecasting figures.
The entire section can be filtered by Tenant/Subscription using the Subscription picker.
Budgets
Monthly budgets can currently be set at a Tenant level, which are then reflected as a total annual budget.
Select the pencil icon to set or adjust a budget for a Tenant. A flyout will then open giving you information about a Tenant's forecasted spend, and whether an existing budget is likely to be breached. You can then set a new monthly budget by entering a value and clicking 'Save Budget'. To unset a budget you can enter a value of 0.
Recurring Spend
Reserved Instances and Software Subscriptions are now combined into a single Recurring Spend page. The Spend Year To Date tile will reflect any invoiced amounts this year, whilst the Average Monthly Spend and Projected Yearly Spend tiles use a rolling prediction algorithm to show likely costs.
Recurring Cost
A table showing all Reserved Instances and Software Subscriptions across all Tenants/Subscriptions. By default, this list is filtered to only show Active items but can be extended to also show Cancelled and Expired. Expired items will be highlighted in the list.
The Total Charge column represents the total value that has been invoiced against the recurring item. The Last Charge column represents the last value invoiced against the recurring item.
Use the Export button to download a CSV file version of this table.
Spend Overview
This graph gives you multiple options to analyse your recurring spend data, meaning you can customise the view to suit your requirements. The graph is based on invoiced amounts, so may appear to be a month behind real-time.
The graph options available are:
- Period:
- Year to Date/Current Year – All invoiced recurring spend so far this year
- Previous Year – All invoiced recurring spend for the previous year
- Month to Date/Current Month - All invoiced recurring spend so far this month
- Previous Month – All invoiced recurring spend for the previous month
- Custom – Ability to view historical, invoiced recurring spend over any time period
- Aggregate:
- None – Spend will be shown per month depending on the selected period
- Cumulative – Spend will be shown as a running total
- View As:
- Bar Chart – Spend and forecast are shown in a bar chart stacked by Recurring Item
- Area Chart – Spend and forecast are shown in an area chart stacked by Recurring Item
- Table – Exact spend figures are shown in tabular format stacked by Recurring Item
- Line – Spend is shown as a single line (no Stack By is available)
- Ledger selections allow you to drill down further into the data by selecting a subset of the displayed recurring items.
Data Export
Exporting Data
The raw data supporting Provide's Azure Spend analysis can be downloaded on a monthly basis in CSV format. Simply select the required month and then click 'Export Data'.
Data Export Example/Column Descriptions
The rest of the Data Export page gives you an insight into the data you will be downloading. The Data Export Example shows you the formats to expect for each column, and the Column Descriptions explain what each part of the data represents.
Where do I find…?
Plan Breakdown (Reserved Instances/Software Subscriptions)
Reserved Instances and Software Subscriptions can now be found on the Recurring Spend tab of the Overview Page.
There is a more detailed analysis of your recurring spend available, but you can also still find the previous level of detail per-Reserved Instance/Software Subscription by clicking on the relevant record in the table.
Usage By Subscriptions
This data is now all included within the Overview page.
The whole page can be filtered by the Subscriptions picker at the top right of the Consumption Summary section.
The Pie/Bar charts for Services/Resource Groups/Regions are now included at the bottom of the Overview page.
Usage By Resource
Some of this data is now included within the Overview page.
The whole page can be filtered by the Subscriptions picker at the top right of the Consumption Summary section, and the Spend Overview graph can be stacked by Resource Group.
The ability to drill down from Subscription to Meter has been replaced by a decomposition-style Resource Explorer.
The export of your raw usage data is now available through the Data Export tab of the Overview page.